

As Ergon Network phases out old tariffs and introduces new options from 1 July 2025, large electricity customers face a key decision: stick with an anytime demand tariff (Tariff 44), or transition to a time-of-use demand tariff (Tariff 50B)?
Each tariff structure rewards different usage behaviours — and choosing the wrong one could result in unnecessary costs. In this blog, we break down the key differences between these two tariff types and help you identify which option may suit your business based on your load profile.
Tariff Comparison
Below is a summary of both tariffs:
| Tariff 44/44A | Tariff 50B | |
|---|---|---|
| Tariff Type | – One monthly demand charge. – Demand charge has a 35kVA free allowance. – Anytime demand and energy structure. – Includes daily supply. | – Two monthly demand charges. – Time-of-use demand and energy structure. – Varies by time of day (peak, shoulder, off-peak). – Includes daily supply. |
| Charging Windows | – Flat charging window (anytime) | – Peak window: 5 pm – 8 pm weekdays – Off Peak window 11 am – 1 pm daily – Shoulder window: All other times except for Off Peak |
Below is a table showing the rates for each tariff:
| Charge Description | Unit | Tariff 44A | Tariff 50B |
|---|---|---|---|
| Demand-free threshold | N/A | 35 kVA | N/A |
| Peak usage | kWh | – | $0.1890 |
| Shoulder usage | kWh | – | $0.2175 |
| Off-peak usage | kWh | – | $0.1890 |
| All usage | kWh | $0.2113 | – |
| Anytime Demand | kVA | $25.37 | – |
| Peak demand charge | kVA | – | $25.37 |
| Shoulder demand charge | kVA | – | $9.39 |
| Supply charge | Daily | $62.40 | $57.22 |
Which Tariff is best for my business?
Choosing the right tariff depends on how your site uses electricity. Take a look at the examples below to see how different options might work for you.
For simplicity, these examples focus on demand charges only.
If you’d like a full review, our team can analyse every cost component — ensuring you’re on the most accurate and cost-effective tariff for your business.
Example 1: Daytime Energy User (e.g a manufacturing facility)
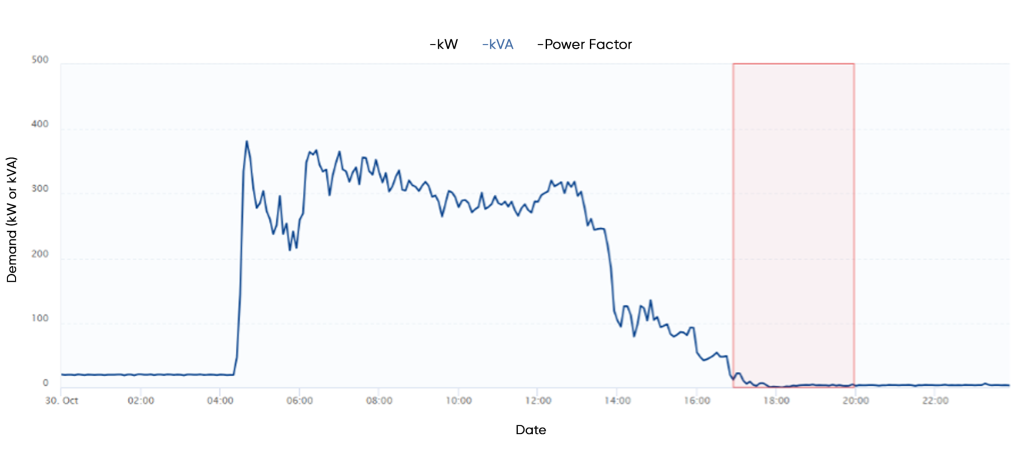
*The above graph shows a sample manufacturing load profile with the peak demand window highlighted in red.
- Operates from 6 AM to 4 PM
- Maximum demand of 380kVA occurring at 4:30 AM, curtailing down to 20kVA from 5PM onwards.
- Best fit:
| Demand Comparison | Demand | 44A ($/kVA) | 44A (Cost) | 50B ($/kVA) | 50B (Cost) |
|---|---|---|---|---|---|
| Anytime Demand (-35kVA) | 345 | 25.366 | $8,751 | – | – |
| Peak Demand | 20 | – | – | 25.366 | $507 |
| Shoulder Demand | 380 | – | – | 9.385 | $3,566 |
| Monthly Demand Cost | – | – | $8,751 | – | $4,074 |
| Monthly Cost Movement | – | – | – | – | $(4,678) |
| Annual Cost Movement | – | – | – | – | $(56,132) |
Example 2: 24 Hour User (e.g. a Pub)
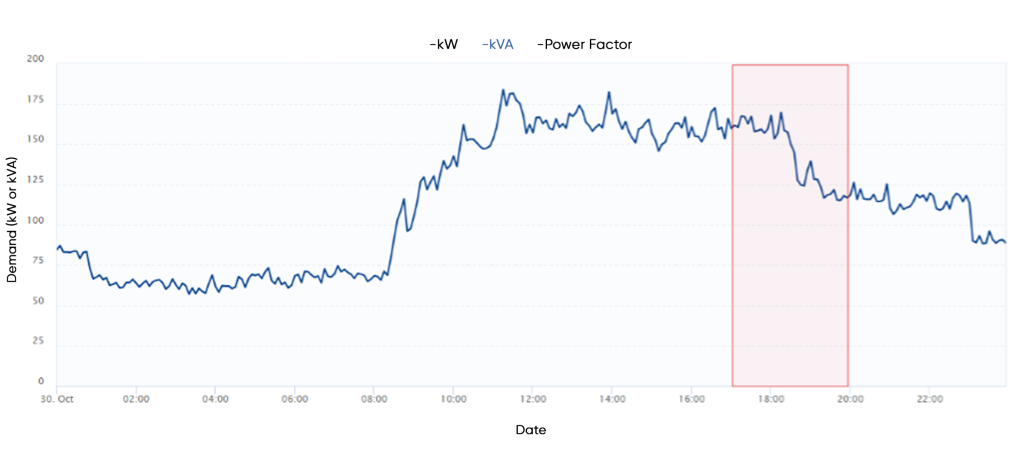
*The above graph shows a sample hospitality venue load profile with the peak demand window highlighted in red.
- Operates 12 hours per day with a constant refrigeration load.
- Demand peaks to 185kVA at 11AM and sustains until 6PM, tapering off slightly to 170kVA
- Best fit:
| Demand Comparison | Demand | DST ($kVA) | DST (Cost) | LTOUD ($kVA) | LTOUD (Cost) |
|---|---|---|---|---|---|
| Anytime Demand (-35kVA) | 150 | 25.366 | $3,805 | – | – |
| Peak Demand | 170 | – | – | 25.366 | $4,312 |
| Shoulder Demand | 185 | – | – | 9.385 | $1,736 |
| Monthly Demand Cost | – | – | $3,805 | – | $6,048 |
| Monthly Cost Movement | – | – | – | – | +$2,244 |
| Annual Cost Movement | – | – | – | – | +$26,923 |
Need Help Comparing Tariff Options?
Choosing between TOU and anytime demand tariffs isn’t just about price — it’s about matching your operational behaviour with the tariff structure. We help C&I customers analyse their interval data, model different tariff outcomes, and identify opportunities to shift demand and save.
Contact our team for a tailored tariff review to prepare your sites for the July 2025 transition.
